Stop guessing what's actually working.
Every LGS subscription includes a live analytics dashboard for your store. Real numbers on what brings players in and what keeps them coming back — no spreadsheets, no guesswork.
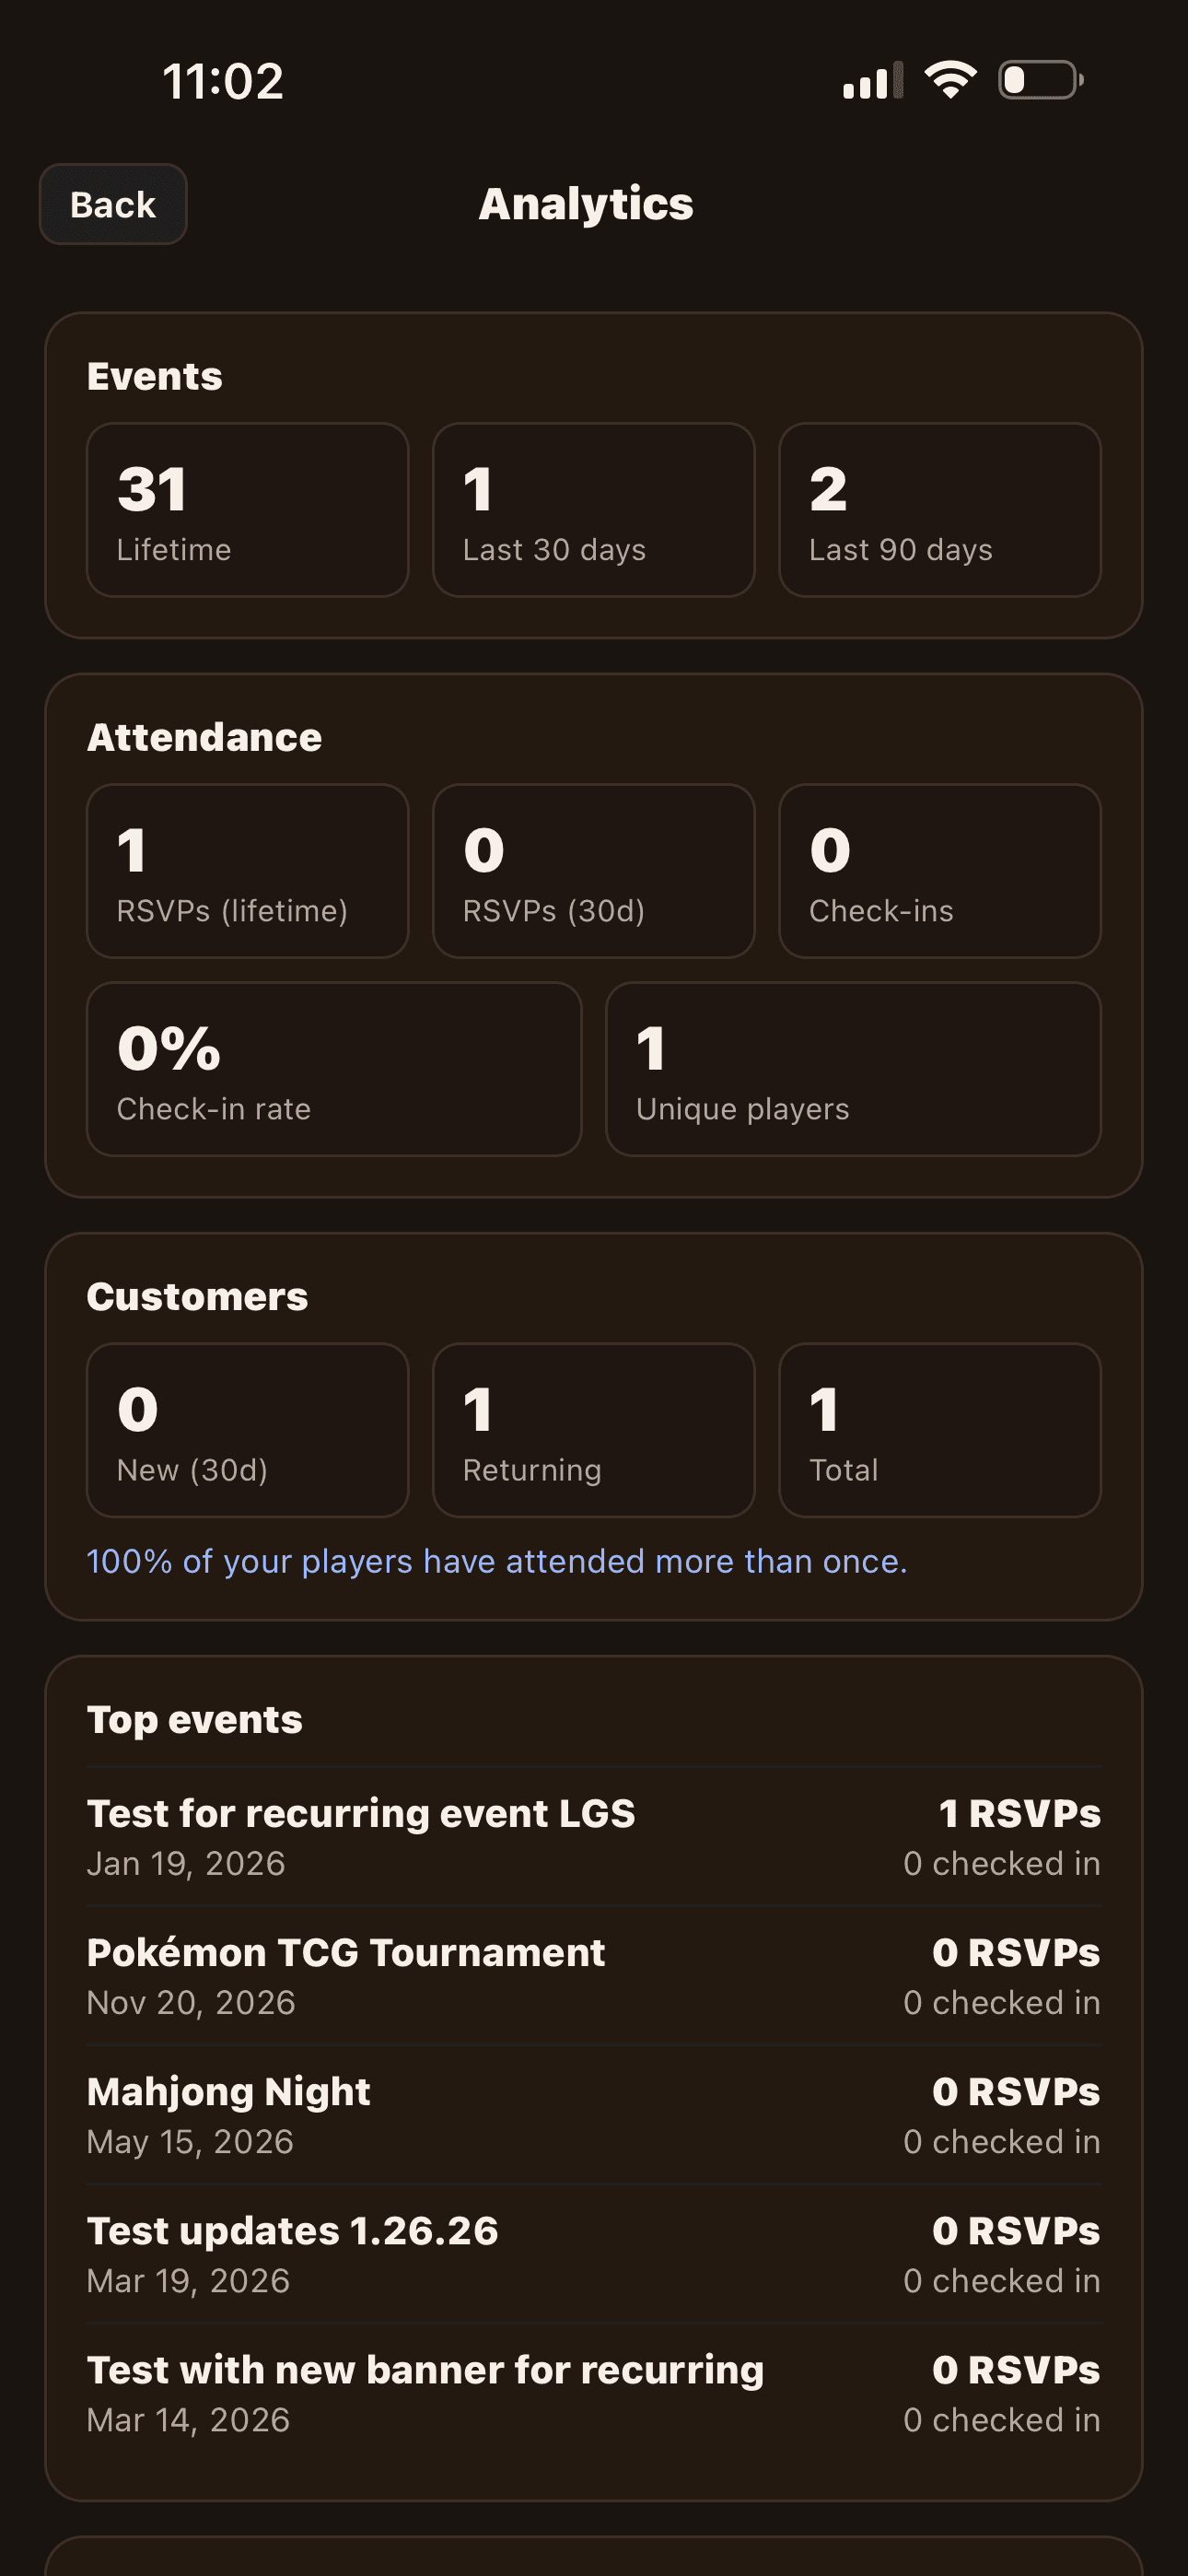
What these numbers tell you
What to run more of
Top events + top series tell you what's drawing the biggest crowds. If FNM averages 21 players and Commander averages 13, you know where to invest your space and staffing.
Whether a new series is working
A new recurring event needs time to find its audience. After 4-6 occurrences, the avg RSVPs number tells you if the series has legs or if it's time to pivot.
How sticky your events are
The check-in rate divides who-RSVP'd by who-actually-showed-up. Below 60%? Time to look at communication, day-of reminders, or the type of event. Above 80%? You're nailing it.
Customer health
New customers in last 30 days vs returning customers: are you growing the base, or just retaining? A healthy store does both. The number tells you which lever to pull.
Privacy: what AleaMeep doesn't do
- We don't share your analytics with other stores or third parties.
- Players see only their own check-in history — never aggregate store data.
- You can only see check-in data for events hosted at your own store.
- No demographic data is exposed. Players are players, not profiles.
Run your store on numbers.
The analytics dashboard is included with every LGS subscription. No extra add-on, no per-event fee.